16. Visualization (Matlab)#
The croco_gui utility has been developped under Matlab software to visualize CROCO outputs.
In Matlab
start
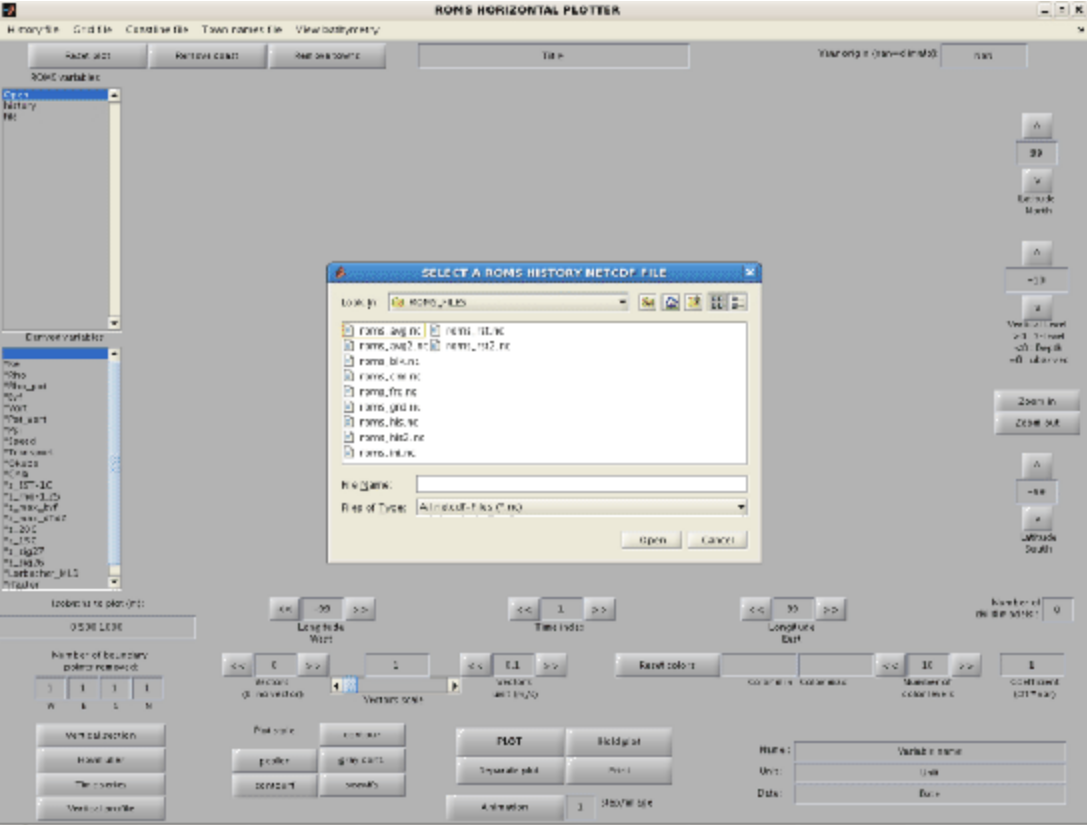
croco_gui
A window pops up, asking for a CROCO history NetCDF file (see screen captions below). You should select croco_his.nc (history file) or croco_avg.nc (average file) and click “open”.
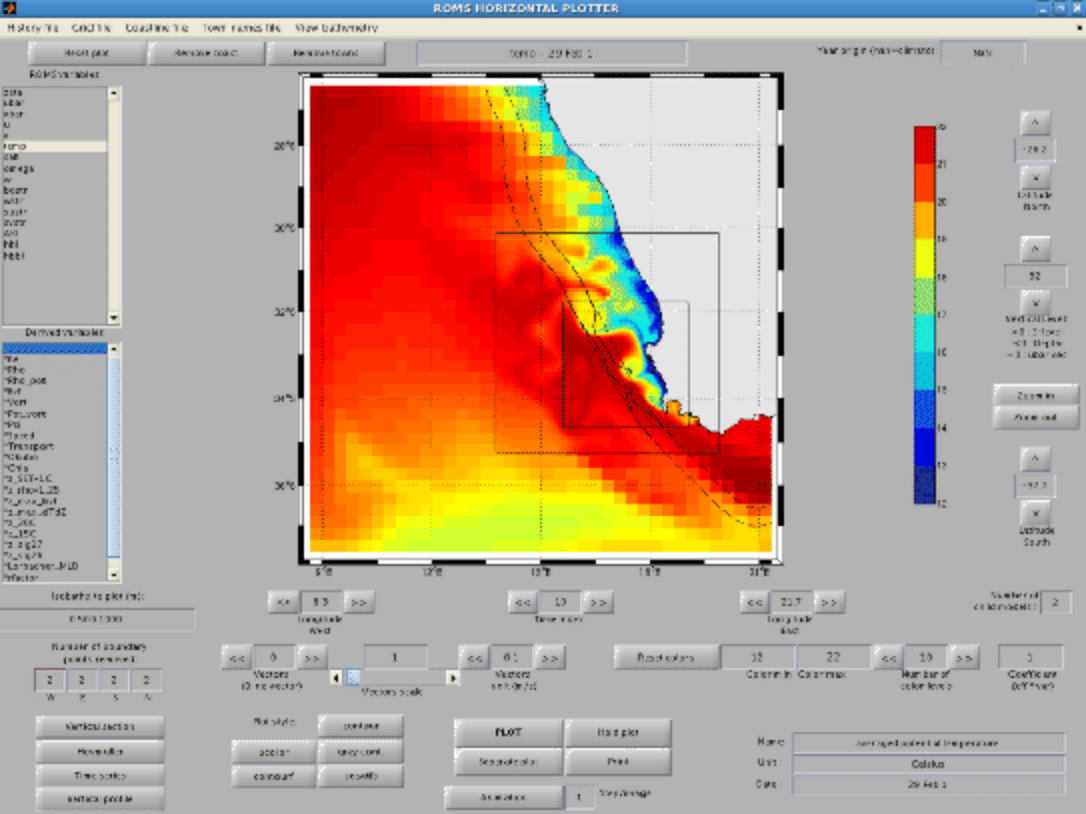
The main window appears, variables can be selected to obtain an image such as Figure below. On the left side, the upper box gives the available CROCO variable names and the lower box presents the variables derived from the CROCO model outputs :
Ke : Horizontal slice of kinetic energy
Rho : Horizontal slice of density using the non-linear equation of state for seawater of Jackett and McDougall (1995)
Pot_Rho : Horizontal slice of the potential density
Bvf : Horizontal slice of the Brunt-Väisäla frequency
Vort : Horizontal slice of vorticity
Pot_vort : Horizontal slice of the vertical component of Ertel’s potential vorticity. In our case, \(\lambda=\rho\)
Psi : Horizontal slice of stream function. This routine might be costly since it inverses the Laplacian of the vorticity (using a successive over relaxation solver)
Speed : Horizontal slice of the ocean currents velocity
Transport : Horizontal slice of the transport stream function
Okubo : Horizontal slice of the Okubo-Weiss parameter
Chla : Compute a chlorophyll-a from Large and Small phytoplankton concentrations
z_SST_1C : Depth of 1°C below SST
z_rho_1.25 : Depth of 1.25 kg/m^3 below surface density
z_max_bvf : Depth of the maximum of the Brunt-Väisäla frequency
z_max_dtdz : Depth of the maximum vertical temperature gradient
z_20C : Depth of the 20°C isotherm
z_15C : Depth of the 15°C isotherm
z_sig27 : Depth of the 1027 kg/m^3 density layer
It is possible to add arrows for the horizontal currents by increasing the “Current vectors spatial step”. It is also possible to obtain vertical sections, time series, vertical profiles and Hovmüller diagrams by clicking on the corresponding targets in croco_gui.